How to Build Better Apps with Data Even If You’re Not an Expert on Mobile App Analytics

So, you want to get into this data-driven approach everybody seems to talk about?
Data analysis can help you a great deal in planning software development or marketing campaigns. The thing is that when it comes to collecting data from apps, there’s plenty to measure. You may easily end up looking at dozens of charts and tables without any idea what to do about them.
But if done right, mobile app analytics can lead you to some useful and valuable insights. Even if you take the first steps in this field.
Sounds promising? Here’s what you need to know for a start.
Key takeaways
- Mobile app analytics involves collecting and analyzing behavioral and demographic data of mobile app users.
- It provides numerous benefits, such as identifying trends and behavioral patterns, pinpointing problems like lower conversion or user retention rates, understanding target groups, detecting bugs, planning app development strategy, and improving the UX.
- Implementing mobile app analytics tools early on is essential. This is typically done through the use of software development kits (SDKs) that contain various tools, including analytical ones like Firebase and AppsFlyer.
- To better understand app analytics, it is important to familiarize oneself with specific key terms.
- Events refer to user interactions or specific occurrences within mobile apps.
- Conversion signifies the completion of a specified action, important for the business.
- Metrics are quantitative and measurable numeric data.
- Segments are groups of users who share common characteristics.
- Sessions represent periods of user interaction with the app.
- New users are those opening the app for the first time and returning users are those who have previously used the app.
- Quantitative data shows what happens, while qualitative data explains why.
- A/B tests compare different design versions to determine which performs better.
What is mobile app analytics?
It involves collecting and analyzing behavioral and demographic data of mobile app users. Analytics tools even allow you to monitor the product’s overall performance and gather info about the devices.
This solution offers you many benefits that directly impact your business. It can help you:
- See the trends and behavioral patterns (that enable you to understand user journey better)
- Identify what causes problems such as for example, lower conversion or retention rate
- Get to know users better and identify the most important target groups
- Create hypotheses
- Find potentially risky areas
- Detect and fix bugs earlier
- Plan the next steps regarding the app development and product strategy
- Improve the user experience (UX) in a mobile app
Before you get to the details, read the definitions of some elementary terms to better understand the basics of analytics.
Useful terms
In this article, we focus mostly on quantitative data. It’s easier and faster to obtain compared to qualitative data. It’s not, however, more important. So, if you’d like to know more about collecting both types of data, check out our previous articles on user research and the product discovery process.
Events – when someone interacts with your app in a certain way or when something specific happens, it’s called an event. For example, events take place when users tap the Add to cart or Complete the order button, add or remove something from their list of favorites, or close a popup window. Even when the app crashes, it’s also an event.
In many mobile analytics tools, some default events are collected automatically. Others software developers add manually. All you need to do as a product owner is to send us a document with info about the events you want to track. We’ll take care of the rest.
Conversion – it takes place when the user completes a specified task that is important for the business. In mCommerce (mobile commerce), it could be making an in-app purchase or adding a product to a cart, joining a loyalty program, creating an account, etc.
Metrics – they’re quantitative, measurable, and show numerical data. For example, the metric Active users shows you how many users were active in your app.
Vanity metrics – metrics that seem important and make us feel better but in fact, they don’t tell you whether you’re making progress. For example, an increasing number of users sounds great. But what if these people aren’t the ones who buy your products and only installed the app by mistake? Vanity metrics suggest it’s time to open a bottle of champagne even though in fact we still don’t know whether there are reasons to celebrate. You need to check additional app metrics to see if it’s true.
Segments – groups of users who have something in common. For example, people with a paid plan can be in the same segment and people on a free plan in the other. User segmentation makes it easier to analyze user behavior, create user journeys, and plan marketing campaigns.
Session – a period when the user interacts with an app from the moment of opening it.
New users – users who open your app for the first time.
Returning users – users who have opened your app before.
Qualitative and quantitative data – quantitative data tells you what happens and qualitative data explains why. You can use quantitative data to make hypotheses that will be further investigated in qualitative research (e.g., in IDIs or usability tests).
A/B tests – they check which design version performs better. The procedure is simple: a designer creates two versions (A and B) of the same app view. Two groups of users see different versions and behave differently. With such tests, you can check which option enhances user engagement more or encourages more users to explore the app.
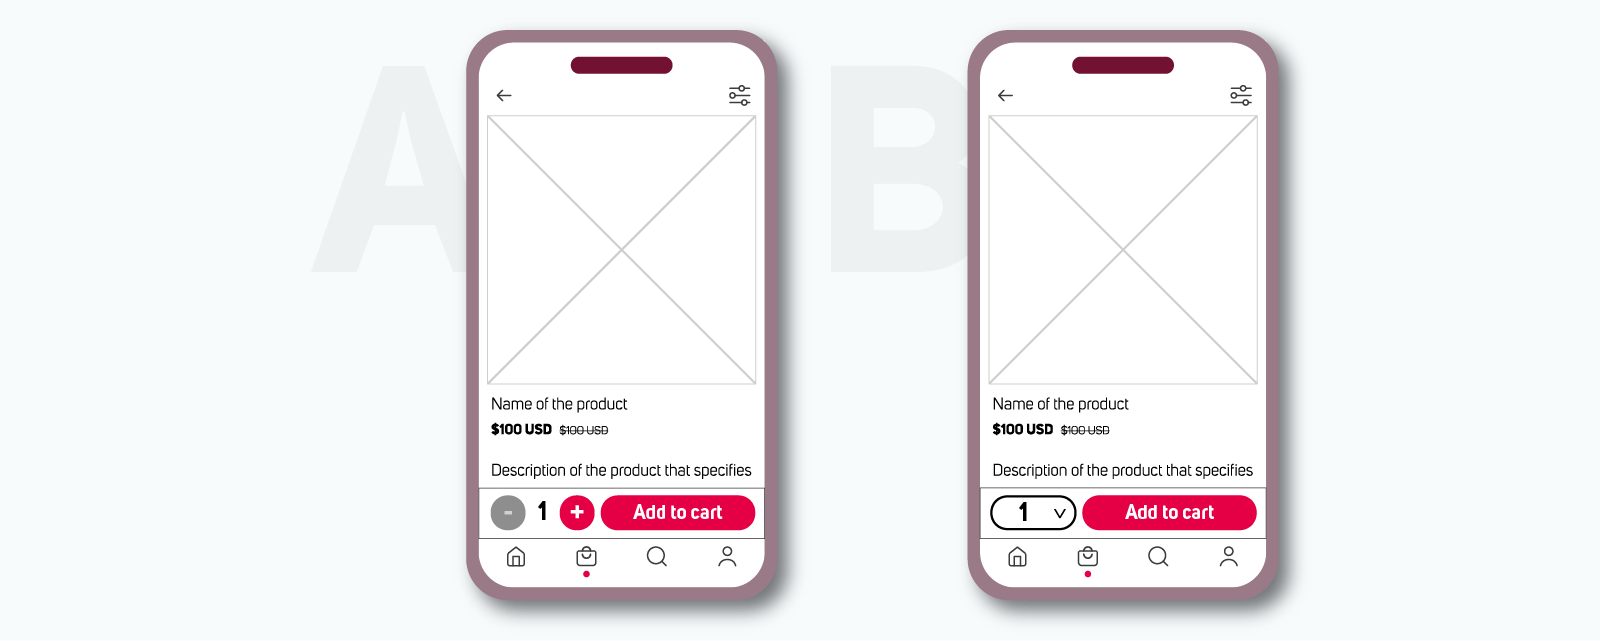
Two versions of UI design that can be used for A/B tests.
The implementation of mobile app analytics tools
The sooner you start gathering data, the better. The first step is the implementation of a mobile app analytics tool.
When app developers build mobile solutions, they use SDKs (software development kits). They are fragments of code with various tools. That includes also the analytical ones (e.g., Firebase, AppsFlyer, Mixpanel, Amplitude, etc.). Developers add it to the app and data collection begins.
What we need from you at this point is the info about the events that you want to track. We will configure the tool to make this possible.
But how do you choose such metrics? In analytics, it all starts with goals.
Choosing goals
First, decide what you want to achieve with data. Ask yourself what problems you’d like to fix or what challenges you’re facing. Key Performance Indicators (KPIs) might be of use, here. These are measurable goals that help you check if you achieve your main objectives.
Then, think of questions that may lead to solutions. Asking the right questions is essential. They determine what metrics you should track and what results you’ll get. So, take your time and do it carefully. Use a dedicated template to make this job easier.
Still not sure how to approach this task? Take a look at some examples.
Mobile app analytics: examples of goals, questions, and metrics
Keep in mind that in every project, the goals, questions, and metrics can be different. Analyze the examples below and use them to think of your own needs.
Planning the product development
Goal: We need to find out what categories and key features we should focus on in the development process. We must also identify the most important ones for the business.
Questions:
- Which categories in the store were visited most often by returning users in the last 3 months?
- How many of them enable adding products to the cart directly from the listing?
- What percentage of visitors used this option?
- Which of these categories brought the company the highest revenue in the last quarter?
- What features were the most popular among the new users within 30 days after their first usage of the app?
Examples of metrics: revenue from transactions in mobile apps, monthly active users (MAU), new and returning users, most and least popular categories, taps on the Add to a cart button
Optimizing marketing performance
Goal: We must plan the next marketing campaigns. For this reason, we have to know how successful the previous one was and what user behavior is typical among users acquired this way.
Questions:
- How many new users were acquired from our social media campaign?
- How many of them have uninstalled the app after the first use?
- How often were they returning to the app in the first 2 weeks after the installation?
- How many of them have joined the loyalty program?
Examples of metrics: installs, churn rate, new accounts in loyalty programs, retention rate, user acquisition channels, percentage of new users from selected channels, and their value
Ensuring better UX
Goal: We wanted to increase user engagement with a new feature. We need to check if the goal was achieved and what other elements might still have a negative impact on the engagement.
Questions:
- Were there more active users among the returning ones in the last 3 months compared to the previous period?
- How many of them use the new feature? How often?
- In the case of customers who use the new feature, how often do they tap the Show recommendations button?
- What is the most common user path from this point?
- Do users return to the app after the first usage of this feature?
- At what point in their journey, the highest number of active users were abandoning the app in the last 3 months?
Examples of metrics: daily active users, retention rate, goal completion rate, taps on a button leading to a given feature, active user path analysis
Eliminating technical problems
Goal: To ensure the app’s stability.
Questions:
- Were there any crashes or errors found the last week?
- How often did they come up?
- What caused them?
- Is the app equally fast on all mobile platforms (iOS, Android)? What is the app load time?
- What is the general app performance on every operating system?
When it comes to technical issues, tools like Firebase Crashlytics offer crash reporting and Performance Monitoring keeps tracks of the performance data. With such solutions, specialists can control the situation and reproduce the bugs which facilitates fixing them.
Don’t walk into an analytical trap
Mobile analytics is helpful when it comes to solving usability problems or planning marketing campaigns. But only if the data is analyzed well. Grab some tips and learn mobile app analytics best practices that should help you be more successful in this task.
Carefully choose the metrics
You don’t want to be flooded with insignificant data. It will only make the analysis more difficult and time-consuming. Especially, if you’re just taking your first steps in data-informed strategy planning. Instead of measuring every possible thing, focus on your goals and make sure you know why you need this data.
Combine different types of data
Although quantitative data is easier to obtain, relying solely on numbers isn’t enough. Quantitative data shows the trends and general tendencies. Using only this type of info, you may focus too much on the average persona and overlook other important but smaller groups of users.
To avoid this and get a new perspective, support your decisions with qualitative research methods, such as user interviews or ethnographic research, for example.
Analyze the data to come up with better ideas
Tracking the events is not enough. Remember that you need to analyze your findings and create hypotheses that should be further verified. Save some time for this task or ask someone to take care of this on a regular basis. Then, you can discuss the results together and decide what steps you should take next.
Don’t forget the bigger picture
When looking at the results of your tests or analysis, don’t focus only on the elements you wanted to evaluate. In order to check their real impact, you need to pay attention to the app’s key metrics as well.
Example Let’s say the A/B tests show that the new element encourages people to explore new content – just as you planned. But at the same time, it makes them less interested in making transactions (which is one of the main business goals). Then maybe this idea needs a second thought.
App analytics can support your decision-making process and improve the app’s usability. We hope that our introduction to this subject has made you more interested in using data in your project. If you need any help with applying this knowledge to practice, let us know.
FAQ
How do mobile app analytics tools facilitate A/B testing?
Mobile app analytics tools facilitate A/B testing by providing developers with the necessary infrastructure to simultaneously deploy and track multiple versions of app features or designs. These tools typically offer features such as experiment setup, randomization of users into test groups, and app’s performance tracking metrics to compare the effectiveness of different variations.
What are some best practices for conducting A/B experiments to optimize app design and UX?
One of the mobile app analytics best practicesBest practices for conducting meaningful A/B in mobile apps tests include clearly defining the hypothesis or goal of the experiment, selecting relevant app metrics to measure success, choosing a sample size large enough for statistical significance, and running tests for an appropriate duration. Segmenting the user base to target specific audience segments and analyzing results based on user demographics or behavior patterns is also important.
What are some common challenges associated with implementing mobile app analytics, especially in terms of collecting accurate and meaningful data?
Implementing mobile app analytics tools early on is crucial for gathering data effectively, but it can come with challenges. One common challenge is ensuring the accuracy and reliability of the data collected. Factors such as user privacy concerns or differences in tracking capabilities across platforms and devices can affect data accuracy. Interpreting the data correctly and extracting actionable insights can be difficult, especially for those unfamiliar with the terminology or best practices of mobile app analytics tools. Overcoming these challenges often requires ongoing education, experimentation, and collaboration between developers, marketers, and data analysts.