Visual Memory Debugging with Xcode 8

Nowadays, there are tools that help us a lot to manage the memory when creating apps. Because of that, most software developers rarely encounter memory problems (or are simply unaware of them). However, every once in a while, we have to face some memory leaks. What do we do then? The most common method is to activate the Instruments tool and debug the problem, which can often be quite laborious. With the release of the new Xcode 8, Apple has introduced a new tool which significantly facilitates that – Visual Memory Debugger.
Creating a Leak
We will make a simple memory leak in order to test the new tool in practice. First, we create a simple class, the object of which may hold a reference to another object of the same class.
class LeakObject {
    var other: LeakObject?
}
Then, we create an equally simple view controller. It will hold a reference to a LeakObject. In the method viewDidLoad(), we will create another object of the same class and link them together.
class MemoryLeakViewController: UIViewController {

    @IBOutlet weak var button: UIButton!

    let firstObject = LeakObject()

    override func viewDidLoad() {
        super.viewDidLoad()


        let secondObject = LeakObject()

        firstObject.other = secondObject
        secondObject.other = firstObject
    }


    @IBAction func buttonAction(_ sender: AnyObject) {
        if let navVC = navigationController {
            navVC.popViewController(animated: true)
        }
    }


}
To facilitate this, I have created a button that will delete our view controller from the navigation stack. Everybody can probably figure out what should happen then. The mutual strong reference of the LeakObjects will allow them to remain in the memory, and a leak will occur. Let us move onto debugging, then!
Visual Memory Debugger
The icon launching the memory debugger is located to the right of the view debugger icon, which is quite frequently used by all iOS software developers.
![]()
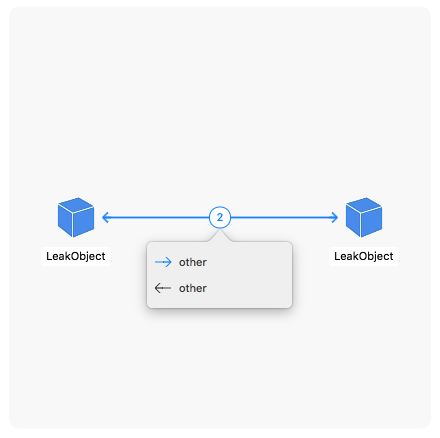
The debugger interrupts the execution of the app and displays a visualization of the memory usage. As we have suspected, deleting the view controller has caused a leak, of which the debugger has meticulously informed us.
The main screen displays a visualization of those objects and their relations.
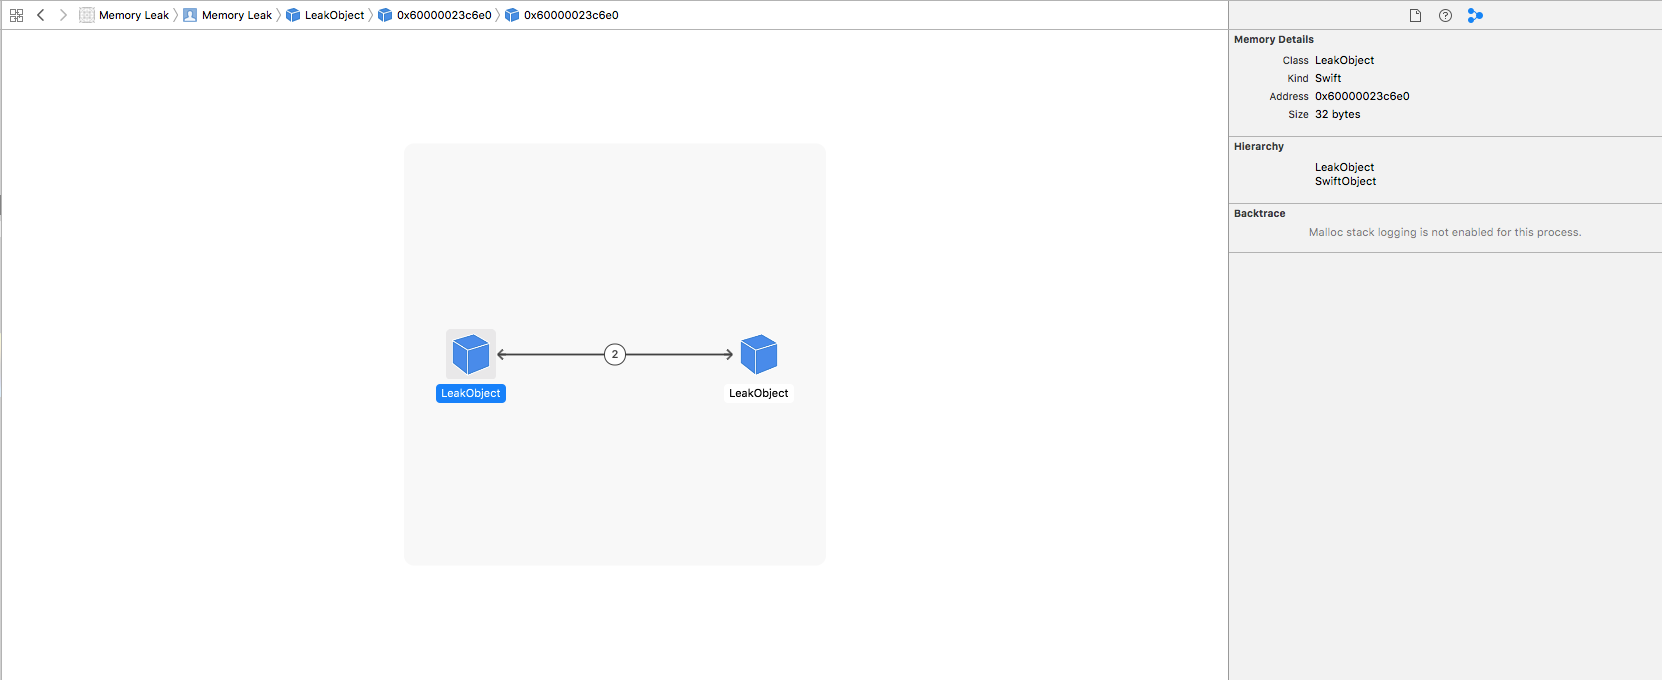
Clicking a specific object will provide us with detailed information on it.
![]()
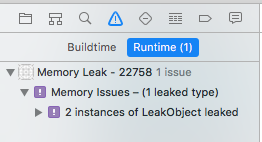
Furthermore, Xcode informed us of the leak while the program was running.
Clicking the purple icon provides us with detailed data on it.
For the purpose of the article, a simple memory leak has been created and then meticulously spotted by Xcode and visualized by the new memory debugger. This tool will definitely be more useful for complicated problems, in larger projects.
The new debugger is intuitive and easy to use in iOS projects. I encourage you to use it at the nearest possible opportunity. You can find more information in Apple’s presentation from the WWDC that took place in June.